
Air Quality Monitoring Services in Hyderabad
You inhale the air of Hyderabad with every breath, unaware of the invisible particles and gases that may be shaping your health. As urban expansion and industrial activity intensify across the city, real-time air quality monitoring has become a necessary tool for residents, schools, and businesses. These services provide precise, localized data on pollutants like PM2.5, nitrogen dioxide, and ozone, empowering you to make informed decisions about outdoor activity, ventilation, and long-term relocation. A mid-sized SaaS firm in Gachibowli recently adjusted employee work hours based on morning AQI spikes, illustrating how granular data translates into practical action.
Key Takeaways:
- Air quality monitoring services in Hyderabad have expanded in response to rising particulate matter levels, particularly PM2.5 and PM10, which frequently exceed national safety thresholds during winter months and periods of high industrial activity.
- Several private firms now offer hyperlocal monitoring solutions, enabling schools, hospitals, and residential complexes to install real-time sensors that feed data into centralized dashboards accessible via mobile applications.
- The Telangana State Pollution Control Board has integrated data from fixed and mobile monitoring stations into public alerts, with color-coded air quality indices displayed at major transit points and online portals.
The Gray Shroud of the Deccan
Hyderabad’s rapid urbanization overlays an older geological reality-the Deccan Plateau’s iron-rich basalt, which influences soil composition and dust profiles. Industrial corridors along the outer ring road stir fine mineral particulates into the air, blending natural and anthropogenic sources. You inhale this complex mixture with every breath outdoors.
Particulate Matter in the Pearl City
A mid-sized SaaS firm in Gachibowli may have state-of-the-art HVAC systems, yet its outdoor air intake pulls in PM2.5 levels that exceed recommended thresholds during peak traffic hours. Construction dust from new high-rises mixes with diesel exhaust, creating a persistent aerosol load measurable block by block.
Seasonal Shadows and Urban Smog
Winter inversions trap emissions close to the ground, turning Hyderabad’s skyline into a muted silhouette by mid-morning. Agricultural burning in neighboring districts drifts in, compounding local sources. You notice the haze thickens between November and February, especially after Diwali.
During the cooler months, reduced wind speeds and lower boundary layer heights limit vertical dispersion of pollutants. Nighttime temperatures drop enough to create stable atmospheric conditions, allowing smoke from biomass burning and vehicular emissions to accumulate. Morning commutes become hazy, with visibility sometimes falling below one kilometer in eastern suburbs near Uppal and ECIL.
Sentinels of the Invisible
Across Hyderabad’s expanding urban footprint, silent monitors stand guard, detecting what the eye cannot see. These sensors, positioned at traffic intersections, industrial fringes, and residential zones, continuously sample the air, transforming invisible pollutants into actionable data. You rely on their readings to understand the city’s respiratory health.
Real Time Tracking Infrastructure
A network of digital dashboards streams live air quality indices from over two dozen monitoring stations across Hyderabad. You access updates through municipal portals and mobile apps, where color-coded alerts reflect shifting conditions minute by minute. This system links ground-level sensors with centralized data hubs, ensuring consistent reporting during peak pollution periods.
Precision Instruments for Pollutant Mapping
Gas analyzers, particulate matter counters, and meteorological sensors form the core of Hyderabad’s monitoring array. You benefit from their ability to distinguish between PM2.5, nitrogen dioxide, and sulfur dioxide, assigning precise concentrations to each. These instruments operate under national calibration standards, maintaining reliability across seasons.
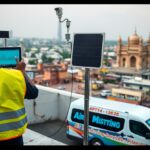
Each monitoring station deploys nephelometers to measure light scattering by airborne particles, providing accurate PM2.5 estimates even in high-humidity conditions common during the monsoon. In industrial belts like Patancheru, chemiluminescence detectors track nitrogen oxide emissions from manufacturing units, allowing regulators to correlate spikes with specific facilities. Mobile sensor vans supplement fixed stations, capturing hyperlocal variations near construction zones or waste processing sites, ensuring no neighborhood remains unmeasured.
The Architecture of Monitoring
A network of fixed and mobile sensors forms the backbone of Hyderabad’s air quality surveillance, strategically placed across high-traffic corridors, industrial belts, and residential zones. These stations continuously collect real-time data on particulate matter, nitrogen dioxide, and sulfur dioxide, feeding into centralized systems for public dissemination and regulatory action.
Industrial Compliance Protocols
Factories in Hyderabad’s manufacturing zones must adhere to emission thresholds set by environmental authorities, with continuous stack monitoring systems transmitting data directly to regulatory databases. Non-compliance triggers automated alerts, enabling swift inspections and corrective measures to prevent prolonged exposure risks to nearby communities.
Residential Air Safety Audits
You can request certified professionals to assess indoor air quality in your home, measuring pollutants like formaldehyde, mold spores, and carbon monoxide from cooking appliances or poor ventilation. These evaluations help identify hidden risks, especially in tightly sealed modern apartments where airborne contaminants accumulate.
Residential audits often reveal elevated particulate levels in homes near construction activity or busy roads, even with windows closed. Testing typically includes humidity, volatile organic compounds, and allergen screening, with results guiding targeted interventions such as HEPA filtration, improved kitchen exhaust, or remediation of damp walls where mold proliferates. A mid-sized SaaS firm recently conducted voluntary audits for employee housing, uncovering unsafe CO2 concentrations in poorly ventilated units, prompting infrastructure upgrades.
Technological Eyes in the Sky
Satellites and mobile sensors now provide real-time snapshots of Hyderabad’s air quality, transforming how you understand pollution patterns across the city. These tools capture data beyond the reach of fixed stations, offering a dynamic view of emissions from traffic, industry, and seasonal sources. Spatial coverage has expanded significantly, allowing for more informed public health decisions.
Satellite Data Integration
Satellite imagery enables you to observe regional pollution trends, such as dust storms from the Thar Desert or crop burning plumes from neighboring states affecting Hyderabad’s atmosphere. Platforms like NASA’s MODIS and ESA’s Sentinel feed into local models, enhancing your ability to forecast air quality episodes and issue timely advisories.
Mobile Sensing Units
Mounted on public transport and municipal vehicles, mobile sensing units collect hyperlocal air quality data across neighborhoods that fixed stations miss. You gain granular insights into pollution hotspots near schools, markets, and congested corridors, improving the precision of urban planning and intervention strategies.
A mid-sized SaaS firm in Gachibowli retrofitted three electric buses with portable PM2.5 and NO₂ sensors, generating continuous data streams across twelve routes. You can access this information through the city’s open-air portal, revealing sharp pollution spikes during morning commutes and near construction zones in Jubilee Hills and Madhapur.
The Human Cost of the Haze
Air pollution in Hyderabad is not an abstract environmental concern-it translates directly into hospital admissions, lost workdays, and diminished quality of life. Chronic exposure to fine particulate matter correlates with rising cases of asthma and bronchitis across the city, particularly during winter months when inversion layers trap pollutants close to the ground.
Respiratory Risk Analysis
You face increased respiratory strain when PM2.5 levels exceed safe thresholds, especially during morning commutes along high-traffic corridors like NH44 or near industrial zones in Patancheru. Short-term exposure can trigger coughing and wheezing; long-term exposure raises the likelihood of developing chronic obstructive pulmonary disease.
Vulnerable Demographics Assessment
Children attending schools near major roads in Secunderabad or elderly residents in densely populated areas like Charminar experience disproportionate health impacts due to prolonged exposure. Their developing or compromised respiratory systems make them more susceptible to airborne toxins commonly found in urban emissions.
A mid-sized SaaS firm in Gachibowli recently adjusted employee work hours after internal surveys linked frequent headaches and fatigue to poor indoor air quality exacerbated by outdoor pollution. This mirrors broader patterns where cognitive performance and physical well-being decline under sustained exposure, particularly among those with preexisting conditions or limited access to filtered environments.
Reclaiming the Blue Horizon
Hyderabad’s skyline once bore the clarity of open skies and sharp silhouettes against the Deccan sun. Today, particulate matter often blurs that outline, but real-time monitoring networks now provide the data backbone for measurable change. You access granular air quality insights that inform policy, urban planning and public behavior, setting a foundation for visible, breathable progress.
Smart City Environmental Integration
Environmental sensors are embedded within Hyderabad’s smart infrastructure, feeding air quality data into centralized urban dashboards. You benefit from synchronized traffic management and industrial compliance alerts, where pollution spikes trigger automated responses like reduced signal idling or factory emission checks, aligning ecological health with city operations.
Strategic Mitigation Consulting
Consultants analyze your facility’s emission profiles using localized monitoring data to identify high-impact intervention points. You receive tailored roadmaps that align with municipal regulations and public health goals, focusing on measurable reductions in PM2.5 and NOx outputs through operational adjustments and technology upgrades.
A manufacturing unit in Patancheru recently used strategic mitigation consulting to reconfigure its ventilation and shift fuel usage patterns, resulting in a documented drop in localized NO2 readings. You gain access to similar operational blueprints, grounded in real-time atmospheric feedback, that balance productivity with environmental responsibility while meeting compliance benchmarks set by Telangana’s pollution control board.
To wrap up
You now understand that air quality monitoring services in Hyderabad provide important data for public health planning and environmental policy. Real-time sensors across the city capture pollutants like PM2.5 and nitrogen dioxide, helping authorities respond to spikes during peak traffic or festival seasons. You can access this data through municipal portals or third-party apps, allowing informed decisions about outdoor activity. A mid-sized SaaS firm in Gachibowli, for instance, adjusted employee schedules based on morning AQI trends, reducing respiratory complaints. Your awareness and use of these services contribute directly to demand for cleaner urban air.
FAQ
Q: What pollutants are commonly monitored by air quality services in Hyderabad?
A: Air quality monitoring services in Hyderabad routinely track particulate matter (PM2.5 and PM10), nitrogen dioxide (NO₂), sulfur dioxide (SO₂), carbon monoxide (CO), ozone (O₃), and ammonia (NH₃). These pollutants are measured using both fixed stations and mobile sensors, particularly in high-traffic zones like Begumpet, Secunderabad, and near industrial corridors such as Patancheru and Jeedimetla. Real-time data helps identify pollution spikes during peak commuting hours or seasonal events like Diwali.
Q: How many official air quality monitoring stations are currently operational in Hyderabad?
A: As of the latest public data, the Telangana Pollution Control Board (TPCB) operates over 15 continuous ambient air quality monitoring stations across Hyderabad. These are distributed across residential, commercial, and industrial zones, including locations like Necklace Road, Masab Tank, and Shamirpet. Some stations are part of the National Air Quality Monitoring Programme (NAMP), while others integrate with the Central Pollution Control Board’s (CPCB) online portal for public access.
Q: Can private companies in Hyderabad access custom air quality monitoring solutions?
A: Private firms, especially in the IT and healthcare sectors, are increasingly adopting on-site monitoring systems. A mid-sized SaaS firm in Gachibowli recently installed a network of low-cost sensors to assess ambient air quality around its campus, integrating the data into its employee wellness dashboard. These systems often pair with HVAC controls to automatically filter air when PM2.5 levels exceed safe thresholds, demonstrating a growing trend in workplace environmental management.
Q: How does weather affect air quality readings in Hyderabad?
A: Hyderabad’s semi-arid climate and seasonal wind patterns influence pollutant dispersion. During winter months, temperature inversions trap pollutants close to the ground, leading to elevated PM2.5 levels. In contrast, the monsoon season temporarily improves air quality through rain scavenging, though construction activity resuming post-rains can cause rapid rebound in dust levels. Wind direction from industrial belts also plays a measurable role in localized pollution episodes in areas like Kukatpally.
Q: Are there community-led air quality monitoring initiatives in the city?
A: Citizen science efforts have emerged in neighborhoods like Banjara Hills and Madhapur, where resident welfare associations have partnered with environmental NGOs to deploy calibrated sensor kits. One such project mapped hyperlocal pollution near a congested school zone, leading to traffic rerouting during drop-off and pick-up hours. These grassroots efforts complement official data by capturing street-level variations that fixed stations might miss.
 Previous Post
 Next Post